Increasing user satisfaction and adoption of Sparks Design System

Spark
6 months
UX/UI Design
Figma, Miro, Maze, Teams
Challenge
NUI is Spark's internal design system, used for its web and app based products. Originally intended to be used by designers and developers, it is now also utilised by other crafts within the business.
Users have different levels of experience and knowledge around using the design system. Feedback channels are not defined, making tracking of requests difficult.
Objectives
To measure user satisfaction and adoption of the design system, while gaining insights into areas for improvement.
To make the design system easier to use, for all users regardless of their experience levels.
To improve the design teams efficiency when managing requests from inside the business.
Outcomes
Improvements made to design system processes, documentation and component library.
More staff utilise the design system and overall satisfaction increased.
+41%
Internal user survey engagement.
+6%
Users using the design system multiple times a day/week.
+150%
Survey engagement from non-core user groups.
Process
For this project I adopted the Double Diamond framework, which divides the design process into four distinct phases: Discover>Define>Design>Deliver. I lead out the project with input from my cross-functional team, which included representatives from user groups of the design system
Discover phase
Before commencing any research, I set the following research goals:
To understand who is using the design system.
To understand how users interact with the design system and its touchpoints.
To identify user pain points and needs.
To gather insights for improvement opportunities.
With direction and clear research goals established, I created a survey that was distributed to Sparks' internal design system users using Maze.com.
View full survey report FY24 Q2
Define phase
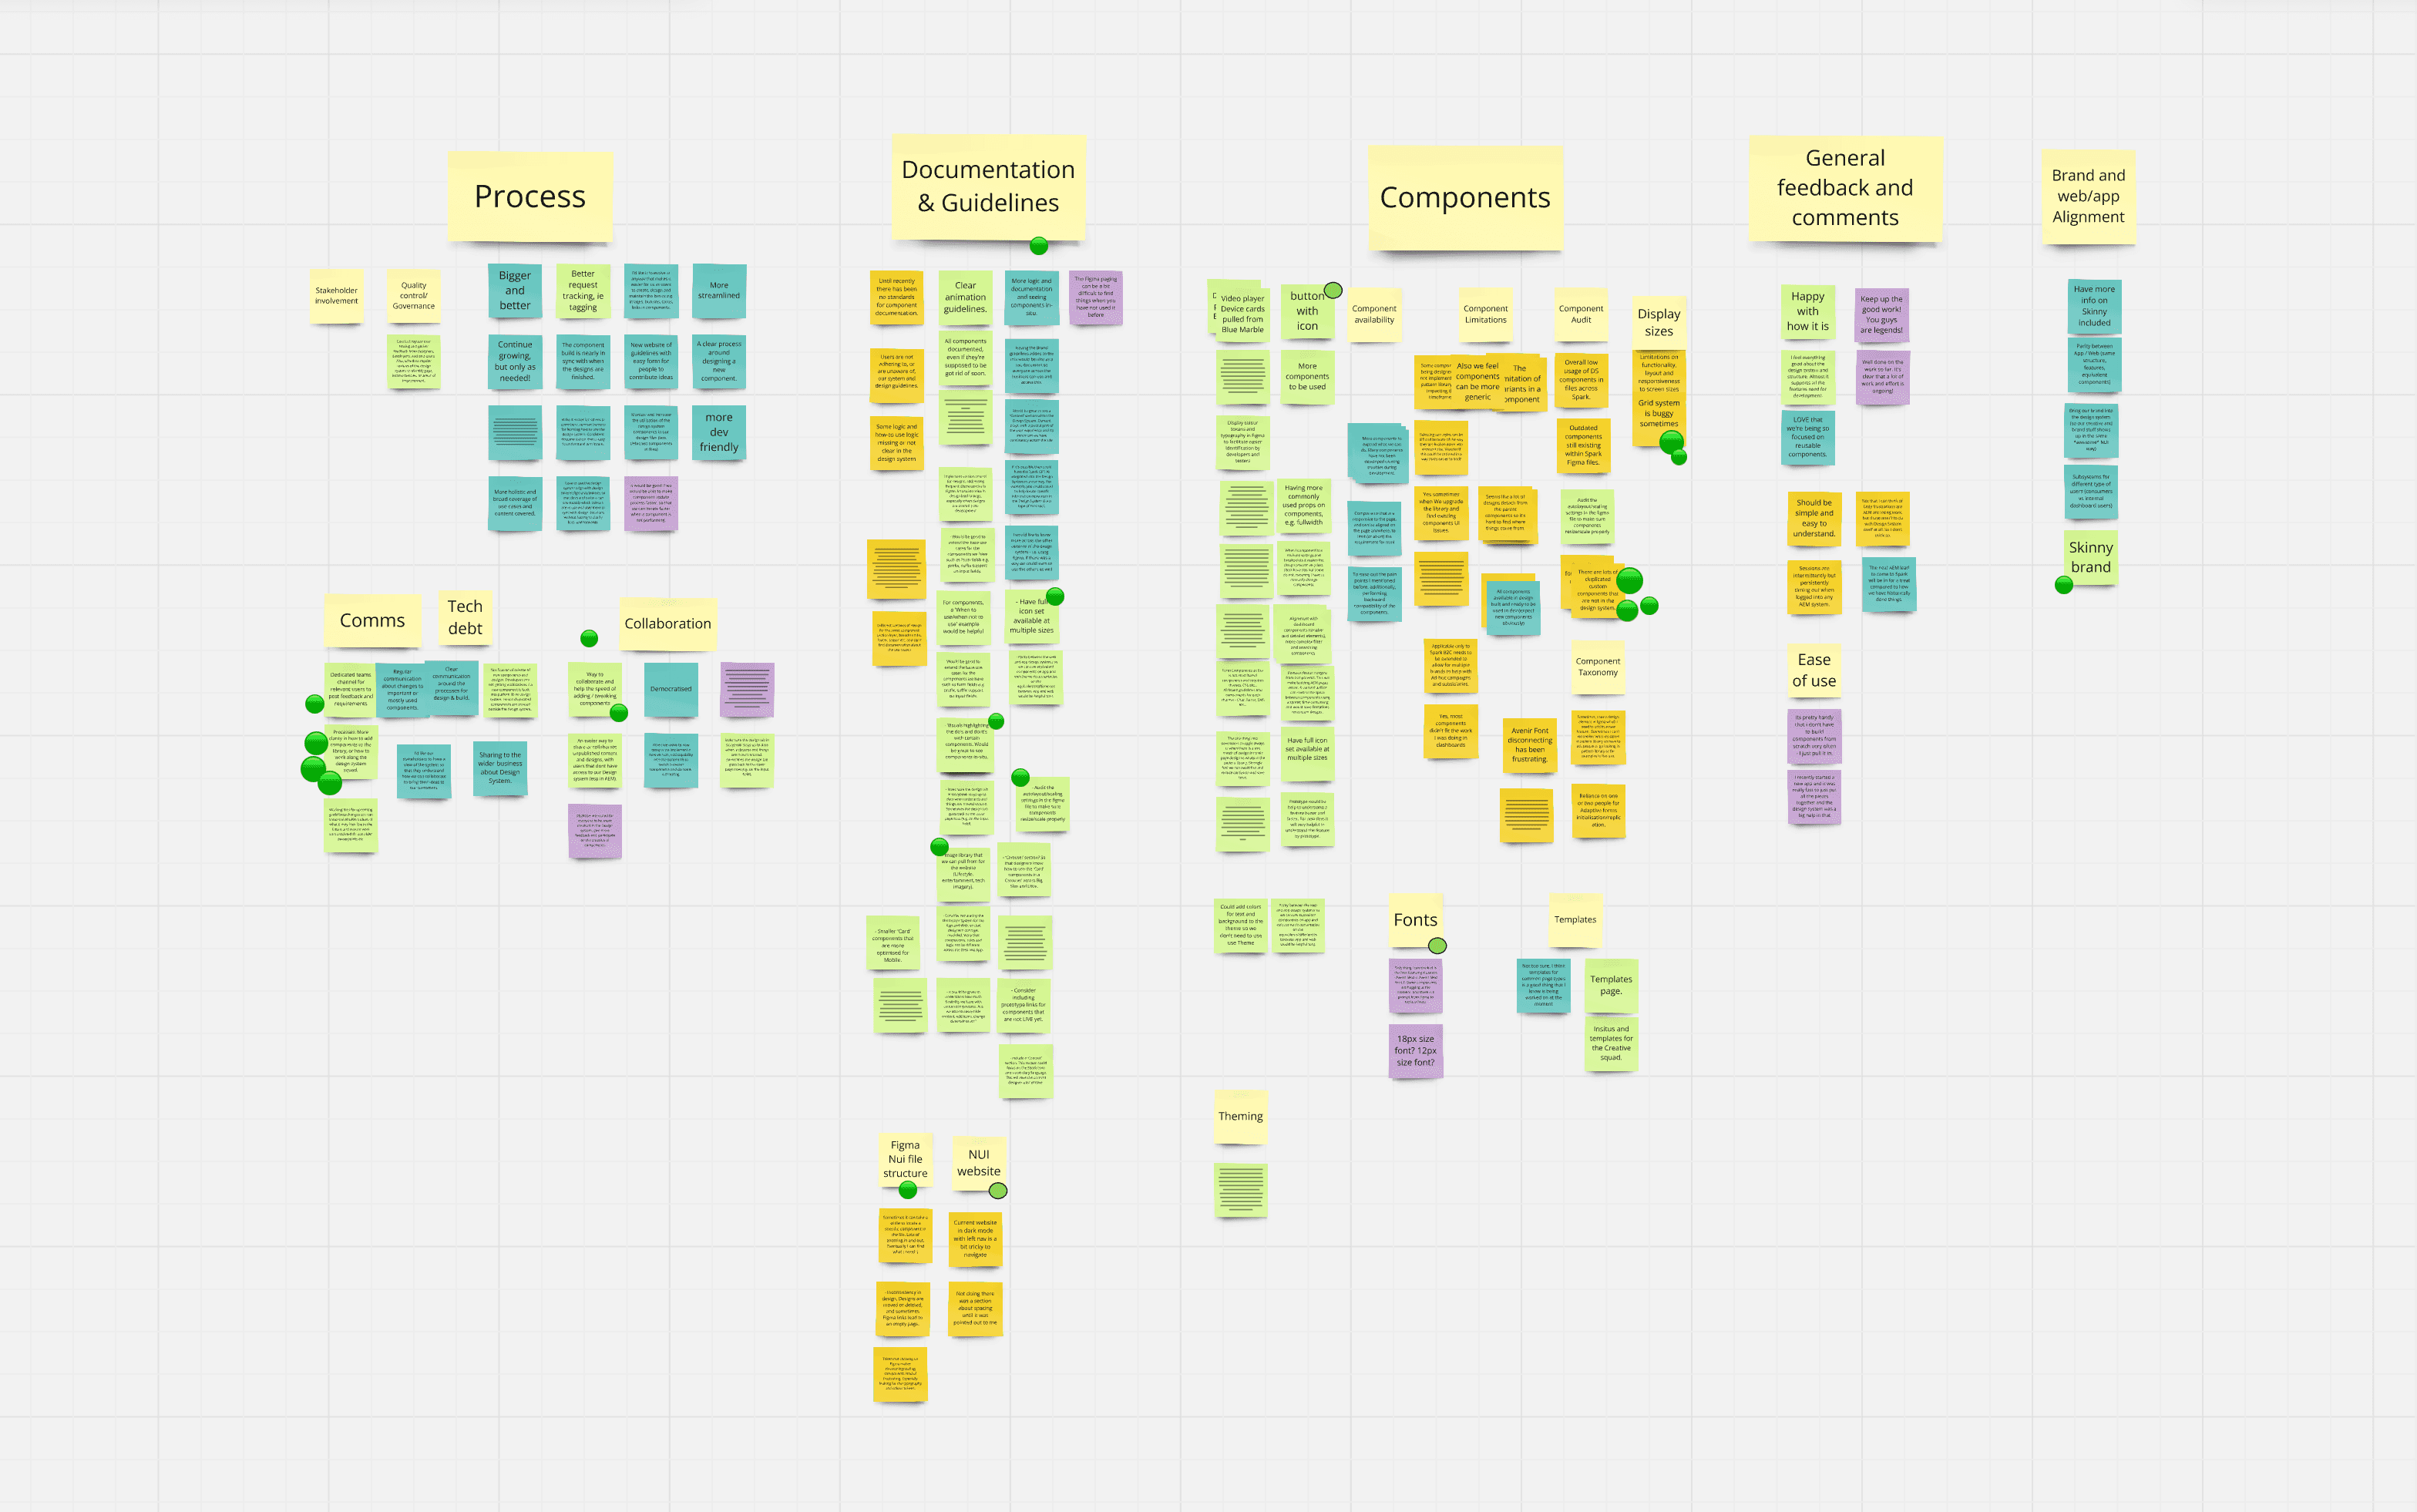
To better understand correlations and trends in the qualitative insights from the survey, I ran an affinity mapping workshop with the full design systems team.
The design systems team consisted of the following crafts, each with their unique perspectives: UX/UI, content, react developer, data analyst and QA tester.
I lead the team through a collaborative affinity mapping session with the user feedback, uncovering three main themes (plus sub-themes):
1) Process
- Communication, collaboration, quality control/governance
2) Documentation & Guidelines
- Component documentation, NUI Figma file structure, NUI design system website, theming
3) Components
- Component availability, limitations, audit, taxonomy, display sizes, templates
The survey results suggested that 75% of users of the design system were react developers, UX/UI and content designers. To better understand our core users, we decided to explore focus groups with the purpose of gathering more rich insights into their needs and pain points.
Before recruitment of participants, I created a discussion guide. This document contained: the stated purpose of the sessions, information about the particpants and the following research goals:
To define a set of opportunities that can work into/adapt our current roadmap to fit.
To gather further evidence to support ROI conversations with key stakeholders.
Establish an ongoing working group that contributes to the design system culture within Spark.
To better support our people to do their best work while improving collaboration across teams.
The focus groups were run over one week, with a one hour session for each of the core user groups. These were fully remotely on Microsoft Teams, to create a space where everyone had equal opportunity to contribute to discussion. The insights and verbatim taken from the focus groups sessions were then grouped, and played back to key stakeholders along with recommendations for next actions.
Design phase
As a team we came together to create a list of backlog items, these were informed by best practise research and based on the recommendations from the survey feedback.
In order to prioritise this work we adopted a matrix, weighing up the effort level of the project and its usefullness for design system users. This was further integrated into our team processes, aiding future decision making around new components requests.
Deliver phase
I completed a full component audit of all of NUI's touchpoints including documentation, Figma and the pattern library. I created a spreadsheet to document the status of each component and variants within NUI's ecosystem.

I worked with team members to agree on a new defined process for handling component requests. The full process was displayed in an easy to read visual chart format, from initial component request through to built component announcement in our NUI Teams channel.
The process chart provides links to the component matrix and checklist mentioned above. Providing this information upfront allows users to check if their requested component already exists or is in development.
The Design phase is broken down into two parts (Discover/Define and Design/Deliver), in accordance with the Double Diamond framework.

A new component "definition of done" guide was also included in the new process chart. This one-page guide detailed acceptance requirements for new components, ensuring that it meets standards for usability, documentation and AAA accessbility.
To assist with setting team priorities for the new financial year, we distributed a new survey to design system users. By doing this we sought to measure any improvements in user satisfaction and adoption over the past two quarter, while uncovering more insights on user behaviour and pain points.
To do this I created an updated survey that branched based on the users demographic questions. I also rewrote several open-ended questions from the previous survey that I felt were too ambiguos, potentially skewing results.
View full survey report FY24 Q4
I am proud of the outcomes of this project, in particular the noticeable increase of user engagement with the NUI design system and its channels within six months. By increasing visibility of our processes and guidelines, while implementing new channels for continuous feedback, like the survey, we have enhanced the user experience of the design system for all users across Spark.